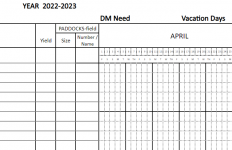
Every year Troy Bishopp, a grazing specialist with Madison County Soil and Water Conservation District in New York, creates a grazing chart that has become popular with graziers across the country. Included are several templates that are dated and undated, templates for pasture and crop monitoring, and several examples as well. Download the free charts here. In addition, On Pasture has posted an instruction sheet to help you get the chart printed in large format so it can be hung on your wall.
Capture.PNG
 
Ever since I saw the Gantt charts I fell in love with them because you can easily map out on a day by day basis how your grazing plan will likely unfold. It also usually includes enough space to record when you moved livestock so that you see planned versus actual. For those who prefer to do this all digitally, Maia Grazing from Australia uses a very similar Gantt chart plus they have some great tools to forecast months into the future where you might have a deficiency in forage so you can plan ahead. Maia Grazing can be found at: https://www.maiagrazing.com/
 
That's great, John! And you are most welcome! Please let us know how PastureMap works for you -- always eager to see customer reviews!
 

Members online

No members online now.
Back
Top